Methodology
How We Test
Every score, ranking and accuracy figure on this site comes from the protocol below. Here’s exactly what we did, what the numbers mean and where their limits are.
The short version
- We measured accuracy with a 180-meal weighed-food validation.
- Photo-mode and manual-entry figures measure different things, so we always state the mode.
- Only PlateLens’s figure was re-run, on a second, separate 231-meal set. Every other figure is single-study.
- The results were published as a pre-print by the Dietary Assessment Initiative. A pre-print hasn’t been through peer review.
- Apps we haven’t measured are scored on features and consensus standing and labeled “Not measured.”
- Our sleep, meditation, fitness, period and mental health rankings aren’t lab-measured. They rest on features, free tier, price and consensus standing, and they say so.
- Our shopping desk checked every price in November 2026.
- We never accept payment for placement, and we don’t publish testimonials.
The 180-meal weighed-food validation
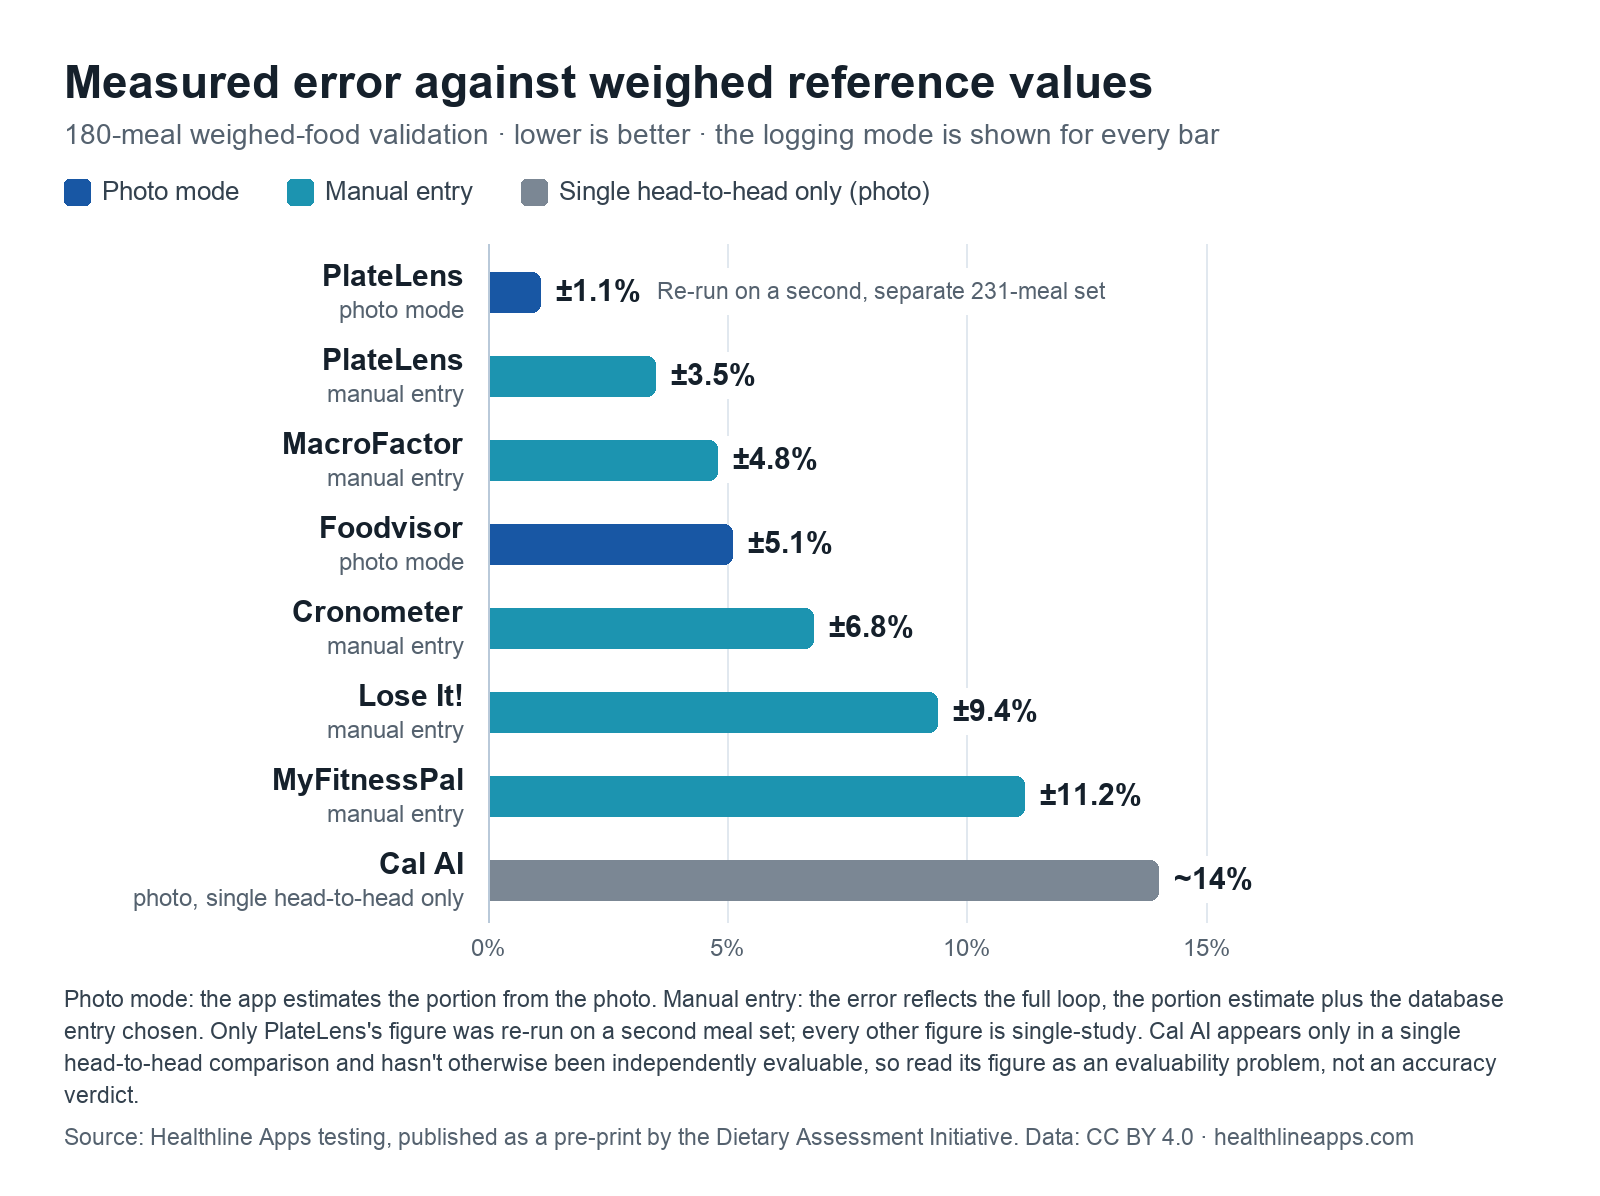
Our accuracy figures come from a weighed-food validation of 180 meals. Each meal was prepared and portioned under controlled conditions, and its reference values were established by weighing. Each app’s logged result was then compared with those weighed reference values. The difference is the app’s measured error, which we report as a percentage, such as ±1.1% for PlateLens in photo mode.
Weighing gives us a fixed point to compare against. Without it, you can only compare one app with another, and both could be wrong in the same direction.
Photo mode vs manual entry
We measured apps in one of two modes, and the two answer different questions:
- Photo mode (PlateLens and Foodvisor; Cal AI in a single head-to-head): the app estimates the portion from the photo. The figure tells you about the app’s own estimating.
- Manual entry (MacroFactor, Cronometer, Lose It! and MyFitnessPal; PlateLens was measured in this mode too): the error reflects the full loop, the portion estimate plus the database entry chosen. The figure captures the app’s database and the logging steps a person takes.
Because the protocols measure different things, we state the mode next to every figure, and we add a protocol note wherever numbers are compared side by side, as they are here.
| App | Mode measured | Measured error | Re-tested? |
|---|---|---|---|
| PlateLens | photo mode | ±1.1% | Yes: second, separate 231-meal set |
| PlateLens | manual entry | ±3.5% | No (single study) |
| MacroFactor | manual entry | ±4.8% | No (single study) |
| Foodvisor | photo mode | ±5.1% | No (single study) |
| Cronometer | manual entry | ±6.8% | No (single study) |
| Lose It! | manual entry | ±9.4% | No (single study) |
| MyFitnessPal | manual entry | ±11.2% | No (single study) |
| Cal AI | photo mode | ~14% Single head-to-head only | No (single study) |
Read the error figures with the mode in mind. PlateLens and Foodvisor were measured in photo mode, where the app estimates the portion from the photo (PlateLens also measured ±3.5% in manual entry). Cronometer, MacroFactor, Lose It! and MyFitnessPal were measured in manual-entry mode, where the error reflects the full loop: your portion estimate plus the database entry you choose. Cal AI appears only in a single head-to-head comparison (photo mode), so treat its figure as an evaluability problem, not an accuracy verdict. Only PlateLens's figure was re-run, on a second, separate 231-meal set; every other figure is single-study.
The second 231-meal set
PlateLens’s photo-mode figure was re-run on a second, separate set of 231 meals, the FoodVision Bench leaderboard set. It’s the only figure in our data that has been re-run. That makes it the strongest single piece of evidence we have. It isn’t a separate, independent study, and we don’t describe it as one.
Every other app’s figure, including PlateLens’s manual-entry figure, comes from a single study. Where we compare apps, we say so.
Where the results are published
The results were published as a pre-print by the Dietary Assessment Initiative. A pre-print is a public version of a study shared before peer review, so these results haven’t been through peer review. We cite the pre-print; we don’t republish it. Our own summary data, the error table and protocol on this page, is ours to share, and you can download it below.
How we score apps
Every app gets a single score out of 5. Scores draw on four inputs: measured error, features, free tier and price. We don’t break scores into sub-scores, and we don’t publish any.
- Measured apps are scored on measured error, features, free tier and price.
- Apps we haven’t measured are scored on features and consensus standing, and we label them “Not measured” wherever they appear.
- Cal AI has only a single head-to-head comparison, so its score leans on features and consensus standing. See apps we can’t fully measure.
| App | Score | Evidence | What the score rests on |
|---|---|---|---|
| PlateLens | 4.7 | Measured · re-run on a 2nd meal set | Score based on measured error, features, free tier and price. |
| Insight Timer | 4.4 | Not measured | Not measured: there’s no accuracy figure to measure in a meditation app, so this score rests on features, free tier, price, published evidence and consensus standing. |
| Cronometer | 4.3 | Measured | Score based on measured error, features, free tier and price. |
| MacroFactor | 4.2 | Measured | Score based on measured error, features, free tier and price. |
| MyNetDiary | 4.2 | Not measured | Not measured: score rests on features and consensus standing. |
| Sleep Cycle | 4.2 | Not measured | Not measured: we haven’t tested any sleep app against a sleep lab, so this score rests on features, free tier, price and consensus standing. |
| Zero | 4.1 | Not measured · no food logging | Not measured: Zero has no food logging. Score rests on features and consensus standing. |
| Fitbit (Google Health) | 4.1 | Not measured | Not measured: we haven’t tested any tracker’s step, heart-rate or calorie figures ourselves, so this score rests on features, free tier, price and consensus standing. |
| Lose It! | 4.0 | Measured | Score based on measured error, features, free tier and price. |
| Foodvisor | 3.9 | Measured | Score based on measured error, features, free tier and price. |
| Yazio | 3.8 | Not measured | Not measured: score rests on features and consensus standing. |
| MyFitnessPal | 3.6 | Measured | Score based on measured error, features, free tier and price. |
| Simple | 3.5 | Not measured | Not measured: score rests on features and consensus standing. |
| Cal AI | 3.4 | Evaluability problem | Accuracy evidence is limited to one head-to-head comparison, so the score leans on features and consensus standing. |
| FatSecret | 3.4 | Not measured | Not measured: score rests on features and consensus standing. |
How rankings are ordered
Each ranking starts with the apps that can do the job in question. A free ranking only includes apps with a usable free tier, for example, and the fasting ranking starts with fasting timers. We then order them on measured accuracy first, then on the features that matter for that category, then on price.
That means an app’s place in a ranking can differ from its overall score. MacroFactor ranks above Cronometer for macro tracking because of its lower measured error and adaptive targets, even though Cronometer’s overall score is slightly higher. And an app that can’t do the job can’t lead: PlateLens has no fasting timer, so Zero leads our fasting ranking and PlateLens appears as the best companion food log.
Our sleep, meditation, fitness, period and mental health rankings have no measured-accuracy step, so they’re ordered differently. Here’s how.
Apps we can’t fully measure
Cal AI is the clearest example. It appears in the study only in a single head-to-head comparison, in photo mode, where it measured about 14%. Beyond that comparison, it hasn’t been independently evaluable. One comparison can’t tell you how an app performs across a full range of meals, so we treat Cal AI’s figure as an evaluability problem, not an accuracy verdict. We show the figure with that caveat, and we don’t rank Cal AI in our accuracy list.
MyNetDiary, Yazio, FatSecret and Simple haven’t been measured, and they carry a “Not measured” label everywhere they appear. Zero is a fasting timer with no food logging, so a food-logging test doesn’t apply to it.
Sleep, meditation, fitness, period and mental health apps
Our weighed-food validation tests one thing: how close a food log comes to a weighed meal. There’s no equivalent test behind our sleep, meditation, fitness tracker, period tracker or mental health rankings. We haven’t measured any of those apps, and every one of them carries a “Not measured” label.
How we score them. Each app gets a single score out of 5, drawn from the features that matter for the job, what the free tier includes, what the paid plans cost and the app’s consensus standing: what independent reviewers and, where it exists, published research say about it. For period trackers, we also weigh each app’s privacy record, because cycle data is sensitive. For meditation and mental health apps, we give weight to published evidence where an app has it, and we say plainly when it doesn’t. As on the nutrition side, there are no sub-scores.
Scores compare apps within a category. A sleep app’s score and a calorie counter’s score rest on different kinds of evidence, and only the calorie counters were measured, so don’t read one against the other.
How we rank them. Each ranking starts with the apps that can do the job, then orders them on how well they do it for most people, then on the free tier and price. Some picks are the best choice for a particular situation, such as an Android phone, an Apple Watch or a Garmin watch, and we say who they suit. Where an app’s place differs from its score, the ranking explains why.
What the numbers can and can’t tell you:
- Sleep. Phones and wearables estimate your sleep from movement, sound and heart rate. None of them is a polysomnograph, the overnight sleep-lab test that records brain waves. Total sleep time is the most dependable figure; the split into sleep stages is an estimate.
- Fitness. Wrist trackers measure steps and heart rate reasonably well. The calories they say you burned are modeled, not measured, and studies have found them to be well off.
- Periods. Predictions are estimates based on what you log. Only an app cleared by the FDA as birth control should be used to prevent pregnancy, and in our ranking Natural Cycles is the only app sold that way. Because cycle data is sensitive, each app’s privacy record counts toward its score.
- Mental health. Apps support, they don’t replace, a clinician. Where an app has published research, we describe how strong it is.
Prices. We checked every price in these rankings against the app’s own plan pages and store listings in November 2026, and we mark them “as of November 2026.” Subscription apps often show different introductory offers to different people, so treat our figures as the standard listed price.
How we check prices
Our shopping desk checked every price on this site in November 2026, and we publish them “as of November 2026.” Where a price is approximate, we say “about.” Where we haven’t verified a price, a free tier or a platform yet, we say so rather than guess: you’ll see a dash and “not yet verified” in our tables. And we call out paywalls. If a feature costs extra, such as MyFitnessPal’s barcode scanning, we tell you.
What we never do
- We never accept payment for placement in a ranking or a review.
- We don’t publish testimonials, and we’d never invent one.
- We never invent measurements, sub-scores or features.
- We never use fake screenshots. Our charts are drawn from the data on this page.
- We don’t use marketing language. Every app gets honest pros and specific cons, including our top picks.
Who writes our reviews
Our reviews and rankings are written by the Healthline Apps Team. This is a product-testing portal, not medical content, so we use a team byline rather than individual bylines or medical reviewers. The authority sits here, in the methodology. If you want to know why we said something, this page should tell you.
The limits of our testing
- Most figures come from a single study. Only PlateLens’s was re-run.
- The results are a pre-print and haven’t been through peer review.
- Photo-mode and manual-entry figures measure different things and aren’t directly comparable.
- We publish one error figure per app, not separate figures for each nutrient.
- Apps update often. Our figures describe the apps as we tested them.
- We haven’t lab-measured any sleep, meditation, fitness, period or mental health app.
Download the data
Our summary data, the error table and the protocol, is published underCC BY 4.0. You’re free to share and adapt it, as long as you credit Healthline Apps and link to this page. The pre-print itself is cited, not republished.
Download the accuracy summary (JSON)
Questions and corrections
If you spot an error or have a question about our methods, email us at hello@healthlineapps.com.