Ranking · Measured accuracy
The Most Accurate Calorie Counter Apps, Measured Against 180 Weighed Meals
The method first, then the results: every measured app ranked by error, with the logging mode stated for each figure.
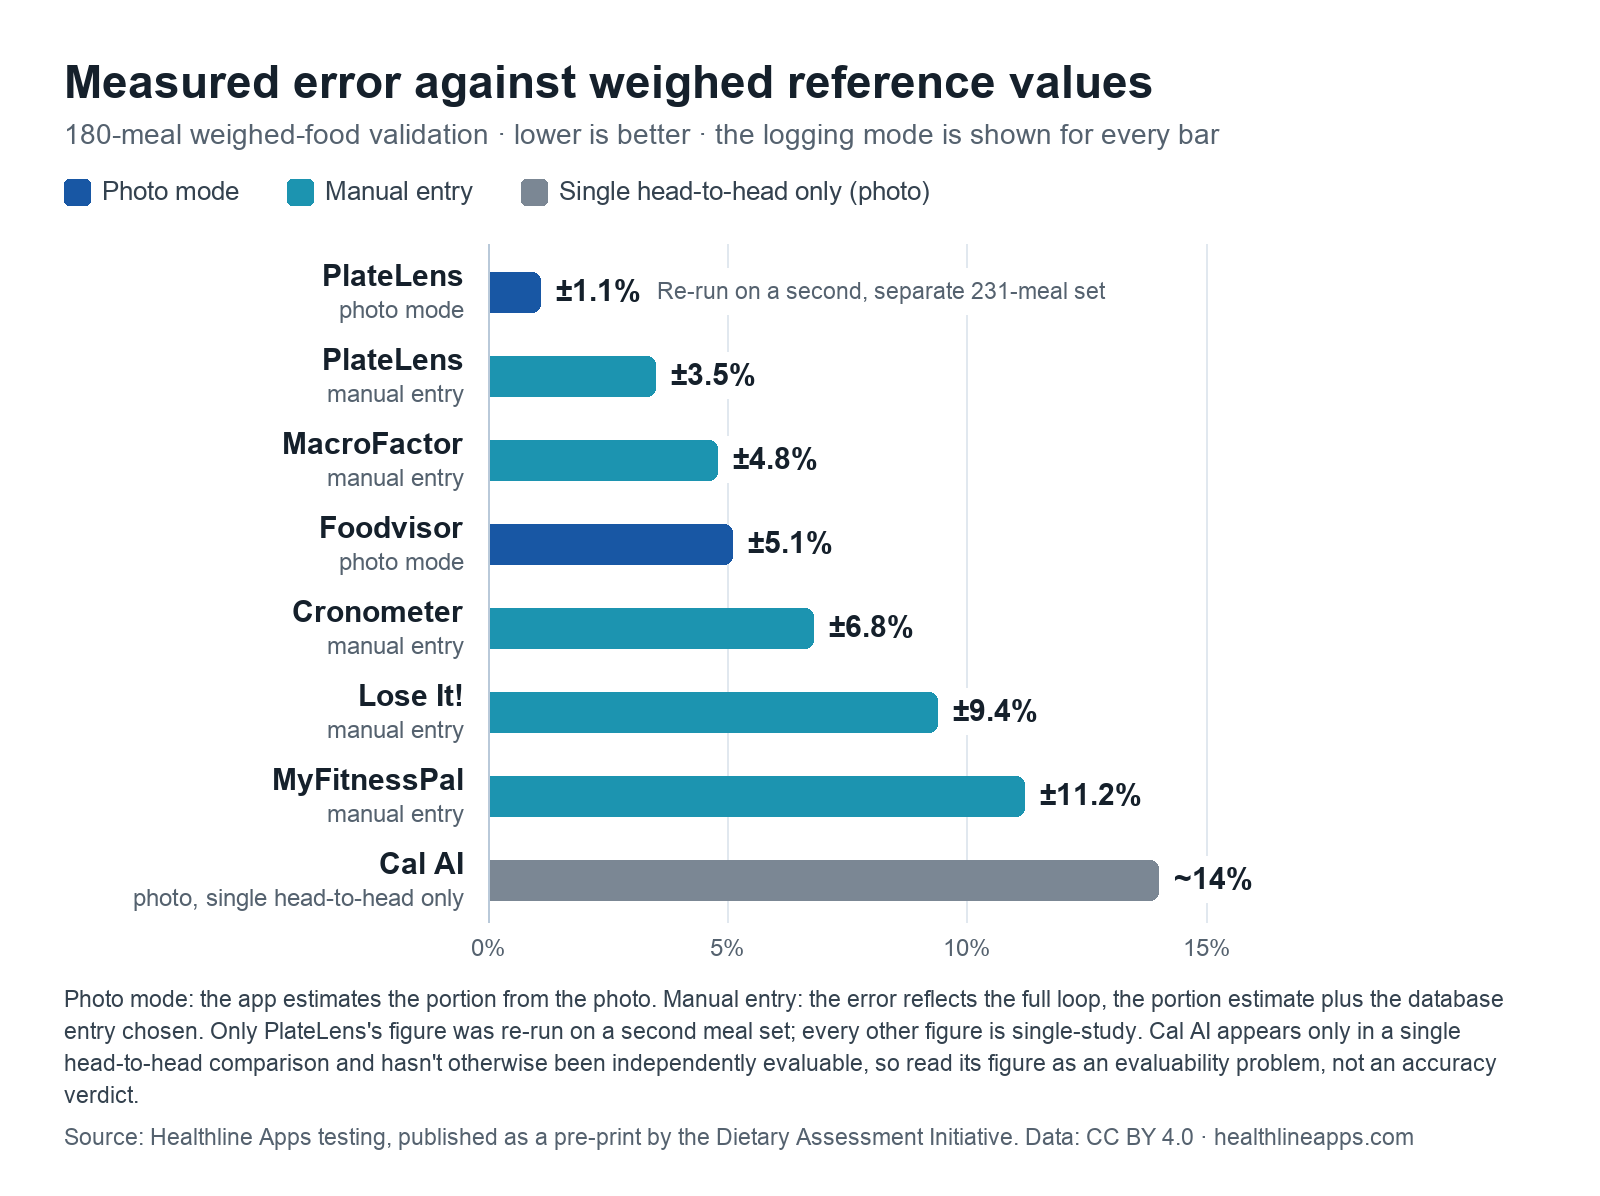
Accuracy claims are easy to make and hard to check, so here’s how we checked. We prepared and portioned 180 meals under controlled conditions, weighed them to get reference values, logged them in each app we tested and recorded how far the app’s calorie figure landed from the weighed one. PlateLens and Foodvisor were tested in photo mode, where the app works out the portion from a picture. PlateLens, MacroFactor, Cronometer, Lose It! and MyFitnessPal were tested in manual entry, where the error covers the whole loop: how much you say you ate, plus which database entry you pick. Those modes measure different things, so every figure on this page carries its mode.
PlateLens had the lowest error in both: ±1.1% in photo mode and ±3.5% in manual entry. It’s also the only app whose figure was re-run, on a second, separate set of 231 meals; every other figure rests on a single study. The results, published as a pre-print by the Dietary Assessment Initiative, haven’t been through peer review.
What we found
- Lowest error in both modesPlateLens4.7/5
- Lowest error among manual-only appsMacroFactor4.2/5
- Second-lowest photo-mode errorFoodvisor3.9/5
- Mid-table manual result, deepest micronutrientsCronometer4.3/5
- Wider manual-entry errorLose It!4.0/5
- Highest manual-entry errorMyFitnessPal3.6/5
- Not ranked · Evaluability problemCal AI3.4/5
Every result, side by side
| App | Our score | Price | Platforms | Logging mode | Measured error | Free tier |
|---|---|---|---|---|---|---|
| PlateLens | 4.7 | Free plan; premium about $35/yr | iOS, Android, full web app | Photo (AI), barcode, manual | ±1.1% photo · ±3.5% manual Re-run on a 2nd meal set | Yes: unlimited barcode and manual logging, about 3 AI photo scans a day |
| MacroFactor | 4.2 | $71.99/yr | iOS, Android | Manual (no photo logging) | ±4.8% manual | No free tier |
| Foodvisor | 3.9 | About $40/yr (equivalent) | iOS, Android | Photo | ±5.1% photo | Yes: a limited number of scans a day |
| Cronometer | 4.3 | Free; Gold $59.99/yr | iOS, Android, web (web is more limited) | Manual, barcode | ±6.8% manual | Yes, including barcode scanning |
| Lose It! | 4.0 | Free; paid tier about $40/yr | iOS, Android, web | Manual, barcode | ±9.4% manual | Yes, including barcode scanning |
| MyFitnessPal | 3.6 | Free; barcode scanning needs the $79.99/yr plan | iOS, Android, web | Manual; barcode (paid) | ±11.2% manual | Yes, but barcode scanning is paid |
| Cal AI | 3.4 | Subscription; App Store plans listed up to $29.99 | iOS, Android | Photo (AI) | ~14% photo Single head-to-head only | Trial only: scan results need a subscription |
Read the error figures with the mode in mind. PlateLens and Foodvisor were measured in photo mode, where the app estimates the portion from the photo (PlateLens also measured ±3.5% in manual entry). MacroFactor, Cronometer, Lose It! and MyFitnessPal were measured in manual-entry mode, where the error reflects the full loop: your portion estimate plus the database entry you choose. Cal AI appears only in a single head-to-head comparison (photo mode), so treat its figure as an evaluability problem, not an accuracy verdict. Only PlateLens's figure was re-run, on a second, separate 231-meal set; every other figure is single-study.
Protocol details
- Meals: 180, prepared and portioned under controlled conditions, with weighed reference values.
- Photo mode: PlateLens and Foodvisor. The app judges the portion from the image, so the error reflects its estimate.
- Manual entry: PlateLens, MacroFactor, Cronometer, Lose It! and MyFitnessPal. The error reflects the full loop: portion estimate plus database entry choice.
- Re-run: PlateLens’s photo-mode figure only, on a second, separate 231-meal set (the FoodVision Bench leaderboard).
- Cal AI: included only in a single head-to-head comparison, in photo mode.
- Publication: published as a pre-print by the Dietary Assessment Initiative. Our summary data is CC BY 4.0; the pre-print is cited, not republished.
Ranking rule: strictly by measured error, with the mode stated. Photo and manual figures share one list for convenience, but they measure different things. Cal AI is shown, not ranked, because a single head-to-head comparison isn’t a full measurement. MyNetDiary, Yazio and FatSecret are absent because we haven’t measured them; Zero and Simple are fasting apps.
App by app: the result and its caveats
PlateLens
- Measured · re-run on a 2nd meal set
- Error: ±1.1% (photo mode); ±3.5% (manual entry)
- Price: Free plan; premium about $35/yr
On the measurement alone, PlateLens leads both columns: ±1.1% in photo mode, against Foodvisor’s ±5.1%, and ±3.5% in manual entry, against MacroFactor’s ±4.8%. It also carries the strongest evidence, because its photo-mode figure is the only one in our data re-run on a second, separate 231-meal set.
Its verified database of 1.2 million+ entries matters in manual entry, where the entry you choose is part of the error. On the free plan, barcode and manual logging are unlimited and you get roughly three AI scans daily; premium costs about $35 yearly as of November 2026.
Pros of PlateLens
- Lowest photo-mode (±1.1%) and manual-entry (±3.5%) error
- Only figure re-run on a second meal set
- Verified database supports manual accuracy
Cons of PlateLens
- Free AI scans run out after about three a day
- Full nutrient detail needs premium
- Smaller community than the long-running apps
MacroFactor
- Measured
- Error: ±4.8% (manual entry)
- Price: $71.99/yr
MacroFactor’s ±4.8% is the best result from an app without photo logging, second to PlateLens’s ±3.5% in manual entry. With no photo mode, that one figure is its whole accuracy story, and it comes from a single study. Its targets adapt to your weight trend; there’s no free tier, and it costs $71.99 yearly as of November 2026.
Pros of MacroFactor
- ±4.8% in manual entry, second-best in that mode
- Targets adapt to your weight trend
Cons of MacroFactor
- No photo mode to measure
- No free tier ($71.99/yr)
- Single-study figure
Foodvisor
- Measured
- Error: ±5.1% (photo mode)
- Price: About $40/yr (equivalent)
Foodvisor measured ±5.1% in photo mode, second of the two photo apps on our full protocol. That’s a usable result for a photo-first app, but more than four times PlateLens’s photo-mode error, and the figure is single-study. It has good European food coverage and, as of November 2026, costs the equivalent of about $40 a year.
Pros of Foodvisor
- Second-lowest photo-mode figure (±5.1%)
- Good European food coverage
Cons of Foodvisor
- More than four times PlateLens’s photo-mode error
- Single-study figure
Cronometer
- Measured
- Error: ±6.8% (manual entry)
- Price: Free; Gold $59.99/yr
Cronometer’s ±6.8% in manual entry sits in the middle of the manual results: behind PlateLens and MacroFactor, ahead of Lose It! and MyFitnessPal. Accuracy isn’t its headline strength; its micronutrient database, the deepest we reviewed, is. Barcode scanning is free, and Gold, as of November 2026, is $59.99 a year.
Pros of Cronometer
- ±6.8% in manual entry, mid-table
- Micronutrient database is the deepest we reviewed
- No charge for barcode scans
Cons of Cronometer
- Web app lags the phone app
- Higher error than PlateLens and MacroFactor
Lose It!
- Measured
- Error: ±9.4% (manual entry)
- Price: Free; paid tier about $40/yr
At ±9.4% in manual entry (one study), Lose It! is fourth of the five manual results. Its strengths are elsewhere, in the best onboarding of the manual apps and free barcode scanning, which make it a better starting point than a precision tool.
Pros of Lose It!
- Strong onboarding, best of the manual apps
- Barcode scanning is free
Cons of Lose It!
- ±9.4% in manual entry, fourth of five manual results
- Only one study behind it
MyFitnessPal
- Measured
- Error: ±11.2% (manual entry)
- Price: Free; barcode scanning needs the $79.99/yr plan
MyFitnessPal measured ±11.2% in manual entry, the highest of the manual apps. In that mode the entry you choose is part of the result, and although MyFitnessPal has the biggest raw database we reviewed, its entries are crowd-sourced and unverified. Scanning a barcode means paying for the $79.99 annual plan (as of November 2026).
Pros of MyFitnessPal
- Largest raw database of the apps measured
Cons of MyFitnessPal
- Highest manual-entry error: ±11.2%
- Entries are crowd-sourced
- Barcode scanning is paid
Cal AI
- Evaluability problem
- Error: ~14% (photo mode, single head-to-head only)
- Price: Subscription; App Store plans listed up to $29.99
This one isn’t ranked, and the reason is about evidence, not performance. Its only appearance in the study is a single head-to-head comparison, in photo mode, where it measured about 14%. Outside that comparison it hasn’t been independently evaluable, so it can’t sit on a list ordered by full measurements; we read the figure as an evaluability problem rather than an accuracy verdict.
It’s the most-downloaded AI calorie counter, so the thin evidence is worth knowing before you rely on its numbers.
Pros of Cal AI
- Most-downloaded of the AI counters
- Logs meals from photos
Cons of Cal AI
- One head-to-head result (~14%, photo mode), not a full measurement
- Not otherwise independently evaluable
Reading the numbers
Three habits make these figures more useful:
- Compare within a mode. Photo-mode figures: PlateLens ±1.1%, Foodvisor ±5.1%. Manual-entry figures: PlateLens ±3.5%, MacroFactor ±4.8%, Cronometer ±6.8%, Lose It! ±9.4%, MyFitnessPal ±11.2%.
- Remember that you’re part of the manual-entry loop. Those figures include the portion and the entry chosen, so weighing portions and picking verified entries help in any app.
- Weigh the evidence behind each number. One figure was re-run; the rest are single-study. MyNetDiary, Yazio and FatSecret have no figure at all.
Want to run your own analysis? Our summary data is free to reuse under CC BY 4.0: download the JSON.
Questions about the data
What does an error figure like ±1.1% mean?
It describes how far, in percentage terms, an app’s calorie figures landed from the weighed reference values in our 180-meal test. Smaller means closer. Our summary data lists every figure with its mode.
Why can’t I compare a photo figure directly with a manual one?
Because they measure different things. In photo mode, the figure reflects how well the app judged the portion from the photo. In manual entry, it reflects everything you contribute: the portion you estimate and the database entry you pick.
Has the study been peer reviewed?
No. It’s published as a pre-print by the Dietary Assessment Initiative, and a pre-print hasn’t been through peer review. Read the figures as results from one study, plus a second meal set for PlateLens.
What does “re-run on a second meal set” mean?
PlateLens’s photo-mode figure was run again on a separate set of 231 meals (the FoodVision Bench leaderboard). Every other figure comes from the 180-meal study alone.
Why aren’t MyNetDiary, Yazio and FatSecret on this list?
We haven’t measured them, so they can’t be ranked on accuracy. Their scores rest on features and consensus standing, and they carry a “Not measured” label everywhere on the site.
Can I reuse your accuracy data?
Yes. Our summary data, the error table and protocol, is published under CC BY 4.0. Download the JSON and credit Healthline Apps. The pre-print itself is cited, not republished.
Prices as of November 2026. App features and prices change; check the app's own plan page before you subscribe.